Chapter 2 Vectorization, *apply and for loops
This section will cover the basics of vectorizations, the *apply family of functions and for loops.
2.1 Vectorization
Almost everything in R is a vector. A scalar is really a vector of length 1 and a data.frame is a collection of vectors. An nice feature of is its vectorized capabilities. Vectorization indicates that a function operates on a whole vector of values at the same time and not just on a single value1. If you have have ever taken a basic linear algebra course, this concept will be familiar to you. Take for example two vectors: \[
\begin{bmatrix} 1 \\ 2 \\ 3 \end{bmatrix} +
\begin{bmatrix} 1 \\ 2 \\ 3 \end{bmatrix} =
\begin{bmatrix} 2 \\ 4 \\ 6 \end{bmatrix}
\] The corresponding R code is given by:
a <- c(1, 2, 3)
b <- c(1, 2, 3)
a + b
## [1] 2 4 6Many of the base functions in R are already vectorized. Here are some common examples:
# generate a sequence of numbers from 1 to 10
(a <- 1:10)
## [1] 1 2 3 4 5 6 7 8 9 10# sum the numbers from 1 to 10
sum(a)## [1] 55# calculate sums of each column
colSums(iris[, -5])## Sepal.Length Sepal.Width Petal.Length Petal.Width
## 876.5 458.6 563.7 179.9Exercise: What happens when you sum two vectors of different lengths?
2.2 Family of *apply functions
apply,lapplyandsapplyare some of the most commonly used class of functions inR*applyfunctions are not necessarily faster than loops, but can be easier to read (and vice cersa)applyis used when you need to perform an operation on every row or column of a matrix or data.framelapplyandsapplydiffer in the format of the output. The former returns a list while the ladder returns a vector- There are other
*applyfunctions such astapply,vapplyandmapplywith similar functionality and purpose
2.2.1 Loops vs. Apply
# Getting the row means of two columns Generate data
N <- 10000
x1 <- runif(N)
x2 <- runif(N)
d <- as.data.frame(cbind(x1, x2))
head(d)
## x1 x2
## 1 0.93196866 0.81751342
## 2 0.14861694 0.47933846
## 3 0.64465639 0.09915633
## 4 0.31383613 0.38192113
## 5 0.28983386 0.42311260
## 6 0.09529535 0.49011556# Loop: create a vector to store the results in
rowMeanFor <- vector("double", N)
for (i in seq_len(N)) {
rowMeanFor[[i]] <- mean(c(d[i, 1], d[i, 2]))
}
# Apply:
rowMeanApply <- apply(d, 1, mean)
# are the results equal
all.equal(rowMeanFor, rowMeanApply)## [1] TRUE2.2.2 Descriptive Statistics using *apply
data(women)
# data structure
str(women)
## 'data.frame': 15 obs. of 2 variables:
## $ height: num 58 59 60 61 62 63 64 65 66 67 ...
## $ weight: num 115 117 120 123 126 129 132 135 139 142 ...# calculate the mean for each column
apply(women, 2, mean)## height weight
## 65.0000 136.7333# apply 'fivenum' function to each column
vapply(women, fivenum, c(Min. = 0, `1st Qu.` = 0, Median = 0, `3rd Qu.` = 0,
Max. = 0))## height weight
## Min. 58.0 115.0
## 1st Qu. 61.5 124.5
## Median 65.0 135.0
## 3rd Qu. 68.5 148.0
## Max. 72.0 164.02.2.3 Creating new columns using sapply
You can apply a user defined function to columns or the entire data frame:
# the ouput of sapply is a vector the 's' in sapply stands for 'simplified'
# apply
mtcars$gear2 <- sapply(mtcars$gear, function(i) if (i == 4) "alot" else "some")

head(mtcars)[, c("gear", "gear2")]
## gear gear2
## Mazda RX4 4 alot
## Mazda RX4 Wag 4 alot
## Datsun 710 4 alot
## Hornet 4 Drive 3 some
## Hornet Sportabout 3 some
## Valiant 3 some2.2.4 Applying functions to subsets using tapply
# Fisher's famous dataset
data(iris)
str(iris)
## 'data.frame': 150 obs. of 5 variables:
## $ Sepal.Length: num 5.1 4.9 4.7 4.6 5 5.4 4.6 5 4.4 4.9 ...
## $ Sepal.Width : num 3.5 3 3.2 3.1 3.6 3.9 3.4 3.4 2.9 3.1 ...
## $ Petal.Length: num 1.4 1.4 1.3 1.5 1.4 1.7 1.4 1.5 1.4 1.5 ...
## $ Petal.Width : num 0.2 0.2 0.2 0.2 0.2 0.4 0.3 0.2 0.2 0.1 ...
## $ Species : Factor w/ 3 levels "setosa","versicolor",..: 1 1 1 1 1 1 1 1 1 1 ...# mean sepal length by species
tapply(iris$Sepal.Length, iris$Species, mean)## setosa versicolor virginica
## 5.006 5.936 6.5882.2.5 Nested for loops using mapply
mapply is my favorite base R function and here are some reasons why:
- Using
mapplyis equivalent to writing nestedforloops except that it is 100% more human readable and less prone to errors - It is an effective way of conducting simulations because it iterates of many arguments
Let’s say you want to generate random samples from a normal distribution with varying means and standard deviations. Of course the brute force way would be to write out the command once, copy paste as many times as you want, and then manually change the arguments for mean and sd in the rnorm function as so:
v1 <- rnorm(100, mean = 5, sd = 1)
v2 <- rnorm(100, mean = 10, sd = 5)
v3 <- rnorm(100, mean = -3, sd = 10)
This isn’t too bad for three vectors. But what if you want to generate many more combinations of means and sds ? Furthermore, how can you keep track of the parameters you used? Now lets consider the mapply function:
means <- c(5, 10, -3)
sds <- c(1, 5, 10)

# MoreArgs is a list of arguments that dont change
randomNormals <- mapply(rnorm, mean = means, sd = sds, MoreArgs = list(n = 100))

head(randomNormals)
## [,1] [,2] [,3]
## [1,] 5.400492 3.606588 -10.544957
## [2,] 4.025367 4.395509 1.248023
## [3,] 5.001900 8.994643 -10.234892
## [4,] 5.004534 2.210005 -10.172234
## [5,] 4.004708 5.368140 -6.539932
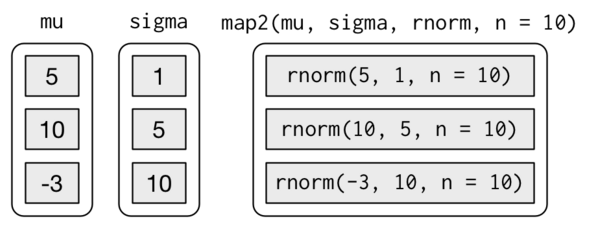
## [6,] 4.478162 14.107530 6.502228The following diagram (from r4ds) describes exactly what is going on in the above function call to mapply:
Advantages:
- Result is automatically stored in a matrix
- The parameters are also saved in
Robjects so that they can be easily manipulated and/or recovered
Consider a more complex scenario where you want to consider many possible combinations of means and sds. We take advantage of the expand.grid function to create a data.frame of simulation parameters:
simParams <- expand.grid(means = 1:10, sds = 1:10)

randomNormals <- mapply(rnorm, mean = simParams$means, sd = simParams$sds, MoreArgs = list(n = 100))

dim(randomNormals)
## [1] 100 1002.3 Creating dynamic documents with mapply
mapply together with the rmarkdown package (Allaire et al. 2016) can be very useful to create dynamic documents for exploratory analysis. We illustrate this using the Motor Trend Car Road Tests data which comes pre-loaded in R.
The data was extracted from the 1974 Motor Trend US magazine, and comprises fuel consumption and 10 aspects of automobile design and performance for 32 automobiles (1973–74 models).
Copy the code below in a file called mapplyRmarkdown.Rmd :
Copy the code below in a file called boxplotTemplate :