Chapter 1 Overview and Descriptive Statistics1
Statistical concepts and methods are not only useful but indeed often indispensable in understanding the world around us. They provide ways of gaining new insights into the behavior of many phenomena that you will encounter in your chosen field of specialization.
The discipline of statistics teaches us how to make intelligent judgments and informed decisions in the presence of uncertainty and variation.
If the yield of a crop were the same in every field, if all individuals reacted the same way to a drug, if everyone gave the same response to an opinion survey, and so on, then a single observation would reveal all desired information.
1.1 Populations and Samples
We are constantly exposed to collections of facts, or data, both in our professional capacities and in everyday activities. The discipline of statistics provides methods for organizing and summarizing data and for drawing conclusions based on information contained in the data.
An investigation will typically focus on a well-defined collection of objects constituting a population of interest: - In one study, the population might consist of all gelatin capsules of a particular type produced during a specified period. - Another investigation might involve the population consisting of all individuals who received a B.S. in mathematics during the most recent academic year.
When desired information is available for all objects in the population, we have what is called a census. Constraints on time, money, and other scarce resources usually make a census impractical or infeasible. Instead, a subset of the population, a sample, is selected in some prescribed manner. Thus we might obtain a sample of pills from a particular production run as a basis for investigating whether pills are conforming to manufacturing specifications, or we might select a sample of last year’s graduates to obtain feedback about the quality of the curriculum.
1.1.1 Variable
We are usually interested only in certain characteristics of the objects in a population: the amount of vitamin C in the pill, the gender of a mathematics graduate, the age at which the individual graduated, and so on. A variable is any characteristic whose value may change from one object to another in the population. Can be categorical (male/female) or numerical (temperature).
| data type | description |
|---|---|
| univariate | consists of observations on a single variable |
| bivariate | observations are made on each of two variables |
| multivariate | more than two variables |
1.1.2 Branches of Statistics
- Descriptive Statistics: summarize and describe important features of the data. Can be graphs (histograms, boxplots, and scatter plots), or numeric summaries (mean, standard deviations, and correlation coefficients)
- Inferential Statistics: Techniques for generalizing from a sample to a population. Having obtained a sample from a population, an investigator would frequently like to use sample information to draw some type of conclusion (make an inference of some sort) about the population. That is, the sample is a means to an end rather than an end in itself.
The relationship between the two disciplines can be summarized by saying that probability reasons from the population to the sample (deductive reasoning), whereas inferential statistics reasons from the sample to the population (inductive reasoning).
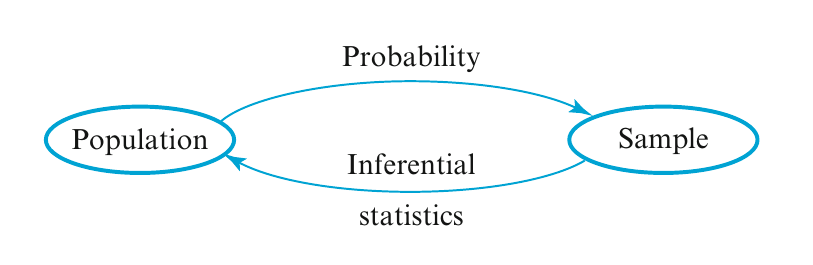
Before we can understand what a particular sample can tell us about the population, we should first understand the uncertainty associated with taking a sample from a given population. This is why we study probability before statistics.
Example 1.1 (Use of manual lap belts in cars equipped with automatic shoulder belt systems) Probability: assume that 50% of all drivers in a certain metropolitan area regularly use their lap belt \(\rightarrow\) an assumption about the population. We might ask - How likely is it that a sample of 100 such drivers will include at least 70 who regularly use their lap belt? - How many of the drivers in a sample of size 100 can we expect to regularly use their lap belt?
Inference: a sample of 100 drivers of such cars revealed that 65 regularly use their lap belt. We might ask- Does this provide substantial evidence for concluding that more than 50% of all such drivers in this area regularly use their lap belt We are attempting to use sample information to answer a question about the structure of the entire population from which the sample was selected.
1.2 Pictorial and Tabular Methods in Descriptive Statistics
1.3 Measures of Location
1.4 Measures of Variability
Devore and Berk.↩