plot method for objects of class popTime
Create a data frame for population time plots to give a visual representation of incidence density
# S3 method for class 'popTime'
plot(
  x,
  ...,
  xlab = "Follow-up time",
  ylab = "Population",
  add.case.series = TRUE,
  add.base.series = FALSE,
  add.competing.event = FALSE,
  casebase.theme = TRUE,
  ribbon.params = list(),
  case.params = list(),
  base.params = list(),
  competing.params = list(),
  color.params = list(),
  fill.params = list(),
  theme.params = list(),
  facet.params = list(),
  ratio = 1,
  censored.indicator,
  comprisk = FALSE,
  legend = TRUE,
  ncol,
  legend.position,
  line.width,
  line.colour,
  point.size,
  point.colour
)

popTime(data, time, event, censored.indicator, exposure, percentile_number)

checkArgsTimeEvent(data, time, event)
Arguments
- x
an object of class
popTimeorpopTimeExposure.- ...
Ignored.
- xlab, ylab
The title of the respective axis. Default: 'Follow-up time' for xlab and 'Population' for ylab
- add.case.series
Logical indicating if the case series should be added to the plot. Default: TRUE
- add.base.series
Logical indicating if the base series should be added to the plot. Default: FALSE
- add.competing.event
Logical indicating if the competing event should be added to the plot. Default: FALSE
- casebase.theme
Logical indication if the casebase theme be used. The casebase theme uses
ggplot2::theme_minimal(). Default: TRUE.- ribbon.params
A list containing arguments that are passed to
ggplot2::geom_ribbon()which is used to plot the population-time area. These arguments will override the function defaults. For example, you can setribbon.params = list(colour = 'green')if you want the area to be green.- case.params, base.params, competing.params
A list containing arguments that are passed to
ggplot2::geom_point()which is used to plot the case series, base series, competing events. These arguments will override the function defaults. For example, you can setcase.params = list(size = 1.5)if you want to increase the point size for the case series points. Note: do not use this argument to change the color of the points. Doing so will result in unexpected results for the legend. See thecolor.paramsandfill.paramsarguments, if you want to change the color of the points.- color.params
A list containing arguments that are passed to
ggplot2::scale_color_manual()which is used to plot the legend. Only used iflegend=TRUE. These arguments will override the function defaults. Use this argument if you want to change the color of the points. See examples for more details.- fill.params
A list containing arguments that are passed to
ggplot2::scale_fill_manual()which is used to plot the legend. Only used iflegend=TRUE. These arguments will override the function defaults. Use this argument if you want to change the color of the points. See examples for more details.- theme.params
A list containing arguments that are passed to
ggplot2::theme(). For exampletheme.params = list(legend.position = 'none').- facet.params
A list containing arguments that are passed to
ggplot2::facet_wrap()which is used to create facet plots. Only used if plotting exposure stratified population time plots. These arguments will override the function defaults.- ratio
If
add.base.series=TRUE, integer, giving the ratio of the size of the base series to that of the case series. This argument is passed to thesampleCaseBasefunction. Default: 10.- censored.indicator
a character string of length 1 indicating which value in
eventis the censored. This function will userelevelto setcensored.indicatoras the reference level. This argument is ignored if theeventvariable is a numeric- comprisk
If
add.base.series=TRUE, logical indicating whether we have multiple event types and that we want to consider some of them as competing risks. This argument is passed to thesampleCaseBasefunction. Note: should beTRUEif your data has competing risks, even if you don't want to add competing risk points (add.competing.event=FALSE). Default: FALSE- legend
Logical indicating if a legend should be added to the plot. Note that if you want to change the colors of the points, through the
color.paramsandfill.paramsarguments, then setlegend=TRUE. If you want to change the color of the points but not have a legend, then setlegend=TRUEandtheme.params = list(legend.position = 'none'. Default: FALSE- ncol
Deprecated. Use
facet.paramsinstead.- legend.position
Deprecated. Specify the legend.position argument instead in the
theme.paramsargument. e.g.theme.params = list(legend.position = 'bottom').- line.width
Deprecated.
- line.colour
Deprecated. specify the fill argument instead in
ribbon.params. e.g.ribbon.params = list(fill = 'red').- point.size
Deprecated. specify the size argument instead in the
case.paramsorbase.paramsorcompeting.paramsargument. e.g.case.params = list(size = 1.5).- point.colour
Deprecated. Specify the values argument instead in the
color.paramsandfill.paramsargument. See examples for details.- data
a
data.frameordata.tablecontaining the source dataset.- time
a character string giving the name of the time variable. See Details.
- event
a character string giving the name of the event variable contained in
data. See Details. Ifeventis a numeric variable, then 0 needs to represent a censored observation, 1 needs to be the event of interest. Integers 2, 3, ... and so on are treated as competing events. If event is afactororcharacterandcensored.indicatoris not specified, this function will assume the reference level is the censored indicator- exposure
a character string of length 1 giving the name of the exposure variable which must be contained in
data. Default isNULL. This is used to produced exposure stratified plots. If anexposureis specified,popTimereturns anexposureattribute which contains the name of the exposure variable in the dataset. The plot method for objects of classpopTimewill use this exposure attribute to create exposure stratified population time plots.- percentile_number
Default=0.5. Give a value between 0-1. if the percentile number of available subjects at any given point is less than 10, then sample regardless of case status. Depending on distribution of survival times and events event points may not be evenly distributed with default value.
Value
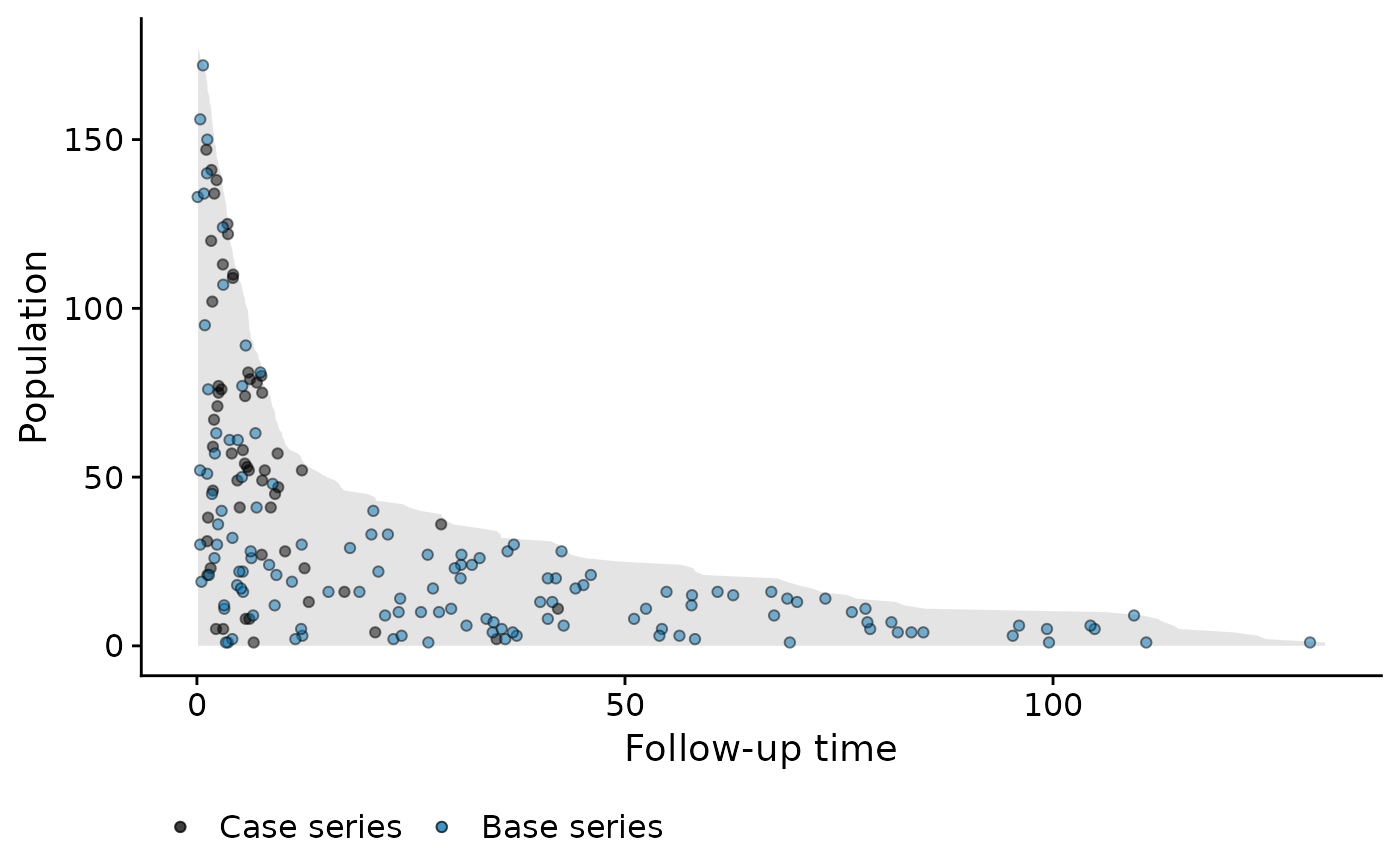
The methods for plot return a population time plot, stratified
by exposure status in the case of popTimeExposure. Note that these
are ggplot2 objects and can therefore be used in subsequent ggplot2
type plots. See examples and vignette for details.
An object of class popTime (or popTimeExposure if
exposure is specified), data.table and data.frame in this
order! The output of this function is to be used with the plot method for
objects of class popTime or of class popTimeExposure, which
will produce population time plots. This dataset augments the original data
with the following columns:
- original.event
value of the event variable in the original dataset - the one specified by the
eventuser argument to this function- time
renames the user specified time column to time
- event
renames the user specified event argument to event
Details
This function leverages the ggplot2 package to build
population time plots. It builds the plot by adding layers, starting with a
layer for the area representing the population time. It then sequentially
adds points to the plots to show the casebase sampling mechanism. This
function gives user the flexibility to add any combination of the
case.series, base.series and competing events. The case series and
competing events are sampled at random vertically on the plot in order to
visualise the incidence density using the popTime function.
That is, imagine we draw a vertical line at a specific event time. We then
plot the point at a randomly sampled y-coordinate along this vertical line.
This is done to avoid having all points along the upper edge of the plot
(because the subjects with the least amount of observation time are plotted
at the top of the y-axis). By randomly distributing them, we can get a
better sense of the incidence density. The base series is sampled
horizontally on the plot using the sampleCaseBase function.
It is assumed that data contains the two columns
corresponding to the supplied time and event variables. If either the
time or event argument is missing, the function looks for
columns that contain the words "time", "event", or
"status" in them (case insensitive). The function first looks for
the time variable, then it looks for the event variable. This order of
operation is important if for example the time variable is named
"event time" and the event variable is named "event
indicator". This function will first (automatically) find the time
variable and remove this as a possibility from subsequent searches of the
event variable. The following regular expressions are used for the time and
event variables:
- time
"[\s\W_]+time|^time\b"- event
"[\s\W_]+event|^event\b|[\s\W_]+status|^status\b"
This allows for "time" to be preceded or followed by one or more
white space characters, one or more non-word characters or one or more
underscores. For example, the following column names would be recognized by
the function as the "time" variable: "time of death",
"death_time", "Time", "time", "diagnosis_time", "time.diag", "diag__time".
But the following will not be recognized: "diagtime","eventtime",
"Timediag"
See also
Examples
# change color of points
library(ggplot2)
data("bmtcrr")
popTimeData <- popTime(data = bmtcrr, time = "ftime", event = "Status")
fill_cols <- c("Case series" = "black", "Competing event" = "#009E73",
               "Base series" = "#0072B2")
color_cols <- c("Case series" = "black", "Competing event" = "black",
                "Base series" = "black")

plot(popTimeData,
  add.case.series = TRUE,
  add.base.series = TRUE,
  add.competing.event = FALSE,
  legend = TRUE,
  comprisk = TRUE,
  fill.params = list(
    name = element_blank(),
    breaks = c("Case series", "Competing event", "Base series"),
    values = fill_cols
  ),
  color.params = list(
    name = element_blank(),
    breaks = c("Case series", "Competing event", "Base series"),
    values = color_cols
  )
)

data("bmtcrr")
popTimeData <- popTime(data = bmtcrr, time = "ftime")
#> 'Status' will be used as the event variable
class(popTimeData)
#> [1] "popTime"    "data.table" "data.frame"
popTimeData <- popTime(data = bmtcrr, time = "ftime", exposure = "D")
#> 'Status' will be used as the event variable
attr(popTimeData, "exposure")
#> [1] "D"
data("bmtcrr")
popTimeData <- popTime(data = bmtcrr, time = "ftime")
#> 'Status' will be used as the event variable
class(popTimeData)
#> [1] "popTime" "data.table" "data.frame"
popTimeData <- popTime(data = bmtcrr, time = "ftime", exposure = "D")
#> 'Status' will be used as the event variable
attr(popTimeData, "exposure")
#> [1] "D"