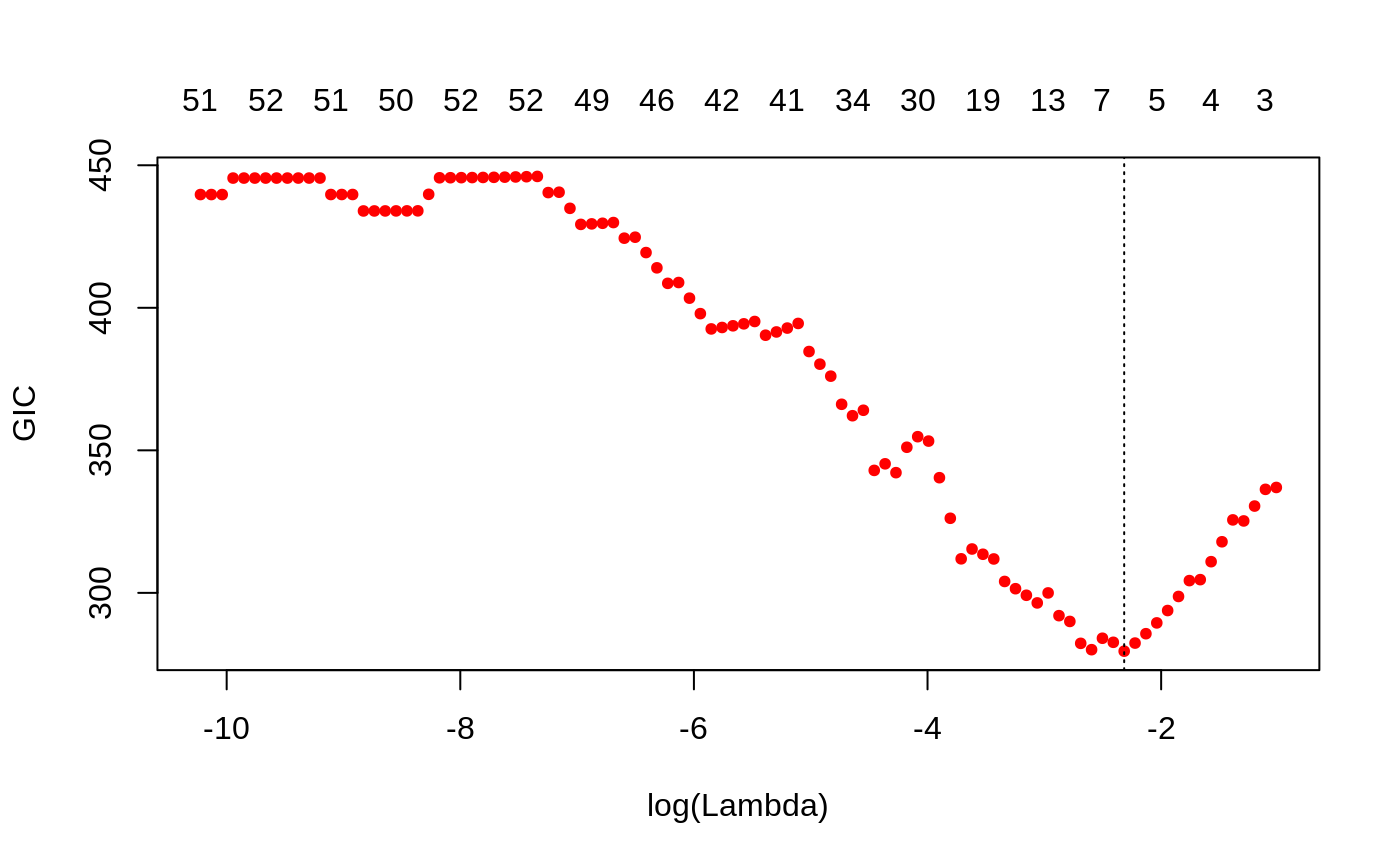
Plots the Generalised Information Criteria curve, as a function of the lambda values used
# S3 method for ggmix_gic
plot(
  x,
  ...,
  sign.lambda = 1,
  type = c("gic", "QQranef", "QQresid", "predicted", "Tukey-Anscombe"),
  s = "lambda.min",
  newy,
  newx
)

plotGIC(x, sign.lambda, lambda.min, ...)
Arguments
| x | fitted linear mixed model object of class |
|---|---|
| ... | Other graphical parameters to plot |
| sign.lambda | Either plot against log(lambda) (default) or its negative if sign.lambda=-1 |
| type |
|
| s | Value of the penalty parameter |
| newy | the response variable that was provided to |
| newx | matrix of values for |
| lambda.min | the value of lambda which minimizes the gic |
Value
plot depends on the type selected
Details
A plot is produced, and nothing is returned.
See also
Examples
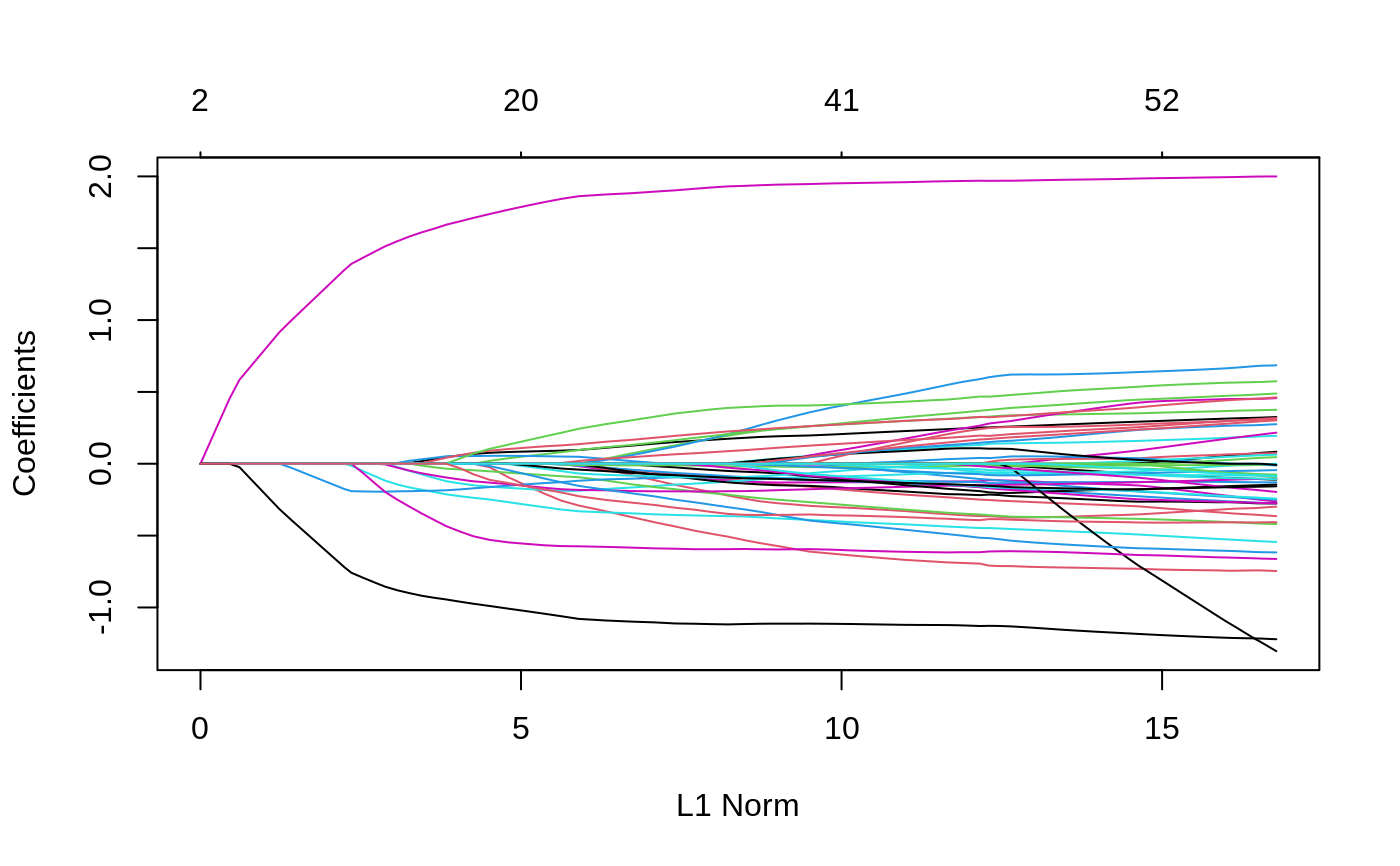
data("admixed") fit <- ggmix(x = admixed$xtrain, y = admixed$ytrain, kinship = admixed$kin_train) hdbic <- gic(fit) # plot solution path plot(fit)